
Climate Change Response Towards Integrated Water Management
(Disclosure 201-2, 303-1:2018)
Climate change is a significant risk factor affecting water resource security in Thailand, particularly in the eastern region. Climate variability is influenced by atmospheric pressure systems and wind circulation from the Pacific Ocean and the Indian Ocean, leading to climate phenomena such as El Niño, La Niña, and the Indian Ocean Dipole (IOD). These fluctuations affect rainfall patterns, reservoir inflows, and the long-term adequacy of water resources.
The Company recognizes the physical risks of climate change that may affect business operations and the ability to provide water services continuously. Therefore, the Company regularly monitors and assesses climate conditions and water resource situations by utilizing precipitation forecasts from the International Research Institute for Climate and Society (IRI) together with data on reservoir inflows, reservoir storage levels, and trends in customer water demand. These data are used as a basis for assessing the adequacy of water resources and for planning water infrastructure development in alignment with long-term climate change conditions.
In 2025, the Company implemented proactive measures to address these risks by strengthening the stability of the water transmission pipeline network in order to enhance water management reliability and reinforce confidence among all sectors that water supply will remain sufficient and continuous. These initiatives are carried out under the concept of Integrated Water Resources Management (IWRM) as follows:
Enhancing the Stability of the Water Transmission Pipeline Network
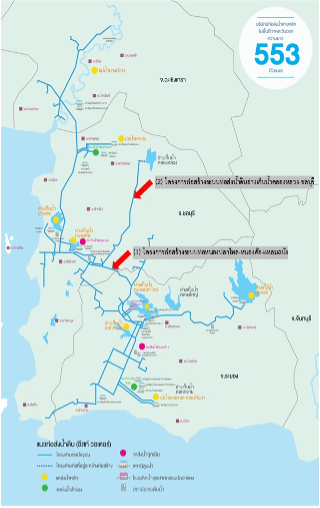
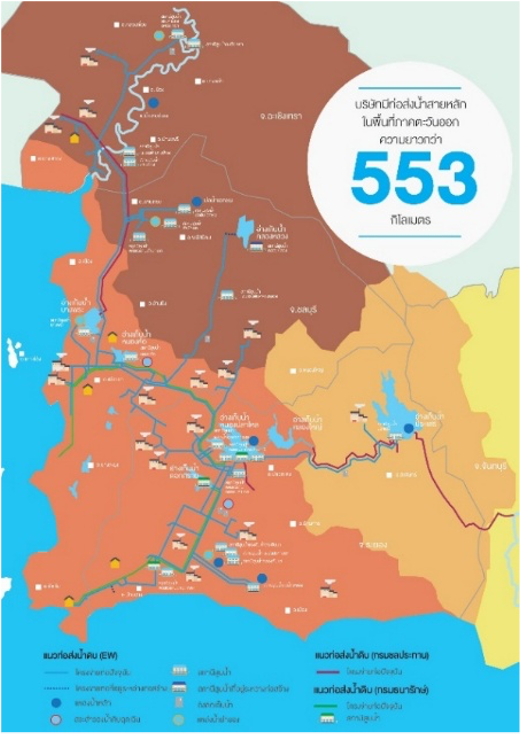
The Company’s water transmission pipeline network covers three provinces in the eastern region, namely Rayong, Chonburi, and Chachoengsao, with a total pipeline length of over 553 kilometers. The network interconnects main water supply sources and backup water supply sources of both the government sector and the Company in the form of a Water Grid, enabling effective management of water from different sources in accordance with water demand in each area and the availability of water supply sources during different periods. This approach maximizes the effectiveness of water management, including the consideration of backup water supply sources to enhance the stability of water supply, as well as the development of the water transmission pipeline network to support risks associated with drought in the eastern region. To strengthen the stability of the water transmission pipeline network, the Company has established an operational plan consisting of three key components:
- Enhancing the capacity of water supply sources
- Development of the water transmission pipeline network (Water Grid)
- Coordination with relevant agencies and advance climate forecasting
Enhancing the Capacity of Water Supply Sources:
Based on an assessment of water demand from the Company’s water transmission pipeline system, including raw water, tap water, and industrial water, water demand at present and in the future is expected to continue increasing in line with government policies supporting economic expansion in the Eastern Economic Corridor (EEC). The Company has therefore reviewed the potential of water supply development projects in various river basins by considering both the adequacy of water supply sources and the locations of water source development in relation to water demand areas. In addition, the Company plans to develop water supply sources to exceed total water demand by not less than 15% in order to accommodate years with lower-than-normal water availability. Accordingly, the Company has prepared a master plan for water source development and water transmission pipeline network development, including improvements to existing pipelines and the construction of additional pipelines to enhance water supply capacity. The plan also considers backup water supply sources in the short, medium, and long term to ensure the stability of raw water supply and strengthen customer confidence in water availability over the next 10 years. The development plan is designed to align with current conditions while avoiding environmental impacts and ensuring that surrounding communities’ water usage is not affected.
Development of the Water Pipeline Network (Water Grid)
The Company continuously implements projects to enhance the capacity of the water grid in order to connect main water sources from reservoirs with backup water supply sources from both government agencies and the Company. This system enables efficient water management and ensures alignment between water supply and water demand in each service area. In 2025, the Company completed the construction of one additional pipeline project enabling water supply to the Laem Chabang area, namely the Nong Pla Lai – Nong Kho – Laem Chabang Water Pipeline Project, and is currently constructing one additional project, namely the Khlong Luang Reservoir – Chonburi Raw Water Pipeline Project, with details as follows:
(1) Nong Pla Lai – Nong Kho – Laem Chabang Water Pipeline Project
This project connects the main water source from Prasae Reservoir with the Company’s pipeline network. It also increases water transmission capacity from Rayong to Chonburi, enabling more efficient water management while supporting the expansion of water supply sources in Chonburi. The project supports water demand in the Eastern Economic Corridor (EEC) and addresses potential water shortages in the future. The pipeline has a transmission capacity of approximately 350,000 cubic meters per day and has been supplying water to the Laem Chabang area since the first quarter of 2025.
(2) Khlong Luang Reservoir – Chonburi Raw Water Pipeline Project
This project connects the main water source from Khlong Luang Ratchalothorn Reservoir with the Company’s water grid, enabling the Company to manage water supply and provide additional water supply sources for the Chonburi and Pluak Daeng – Bo Win areas. The project supports water demand in the Eastern Economic Corridor (EEC) in accordance with government policy and helps address potential water shortages in the future. The pipeline has a water transmission capacity of approximately 142,000 cubic meters per day. Construction progress has reached 93%, and the system is currently capable of reverse water flow through the pipeline.
Coordination with Relevant Agencies and Advance Climate Forecasting
To ensure that water management planning remains appropriate and aligned with current conditions, the Company closely collaborates with relevant agencies such as the Royal Irrigation Department, the Provincial Waterworks Authority, the Industrial Estate Authority of Thailand, the Eastern Region Keyman Water War Room, the Office of the National Water Resources (ONWR), the Water and Environment Institute for Sustainability, the Eastern Economic Corridor Policy Committee Office, the Thai Meteorological Department, and the Department of Royal Rainmaking and Agricultural Aviation. This collaboration includes monitoring rainfall conditions, reservoir inflows, and short- and long-term climate trends, as well as jointly planning water management during periods of potential water risk.

Integrated Water Management
The water sources managed by the Company consist of surface water pumped from various sources. These water sources can be classified into two categories based on their utilization, namely main water sources and backup water sources, as detailed below.
Main Water Sources
Main water sources refer to water sources allocated to the Company under the Water Resources Act and water sources allocated by the Royal Irrigation Department. Reservoirs of the Royal Irrigation Department are reservoirs continuously replenished by natural waterways or through-flowing streams. These also include rivers and canals from which the Company has been permitted by the River Basin Committee to pump water, as well as raw water purchased from private operators. These sources include Prasae Reservoir, Nong Pla Lai Reservoir, Dok Krai Reservoir, Bang Phra Reservoir, Nong Kho Reservoir, private ponds, the Bang Pakong River, and the Rayong River (Khlong Thab Ma).
Backup Water Sources
Backup water sources refer to water sources reserved by the Company to enhance the stability of the main water sources. Water must be stored in advance and will be used when water levels in the main water sources are low or when water shortages occur. These also include raw water ponds owned by the Company, namely the Thab Ma, Samnakbok, and Chachoengsao raw water ponds.

Volumes of total water withdrawal by the Company in 2023-2025 (Three years period) (Disclosure 303-3:2018, 303-5:2018)
| Water Source | Allocated Water (per written permit) Billion liters | Pumped Water in 2023 Billion liters | Pumped Water in 2024 Billion liters | Pumped Water in 2025 Billion liters | |||
|---|---|---|---|---|---|---|---|
| Total dissolved solids (≤ 1,000 mg/liter) Billion liters | Total dissolved solids (> 1,000mg/liter) Billion liters | Total dissolved solids (≤ 1,000 mg/liter) Billion liters | Total dissolved solids (> 1,000mg/liter) Billion liters | Total dissolved solids (≤ 1,000 mg/liter) Billion liters | Total dissolved solids (> 1,000mg/liter) Billion liters | ||
| 1. Prasae Reservoir | 110.00 | 51.48 | 0.00 | 60.82 | 0.00 | 36.72 | 0.00 |
| 2. Nong Plalai Reservoir * | 120.00 | 99.75 | 0.00 | 143.32 | 0.00 | 137.51 | 0.00 |
| 3. Dok Krai Reservoir | 116.00 | 69.99 | 0.00 | 7.71 | 0.00 | 0.00 | 0.00 |
| 4. Bang Phra Reservoir | 8.00 | 6.12 | 0.00 | 3.88 | 0.00 | 3.67 | 0.00 |
| 5. Nong Kho Reservoir | 16.70 | 9.71 | 0.00 | 1.11 | 0.00 | 0.00 | 0.00 |
| 6. Bang Pakong River (Water Stress) | 50.00 | 28.45 | 0.00 | 27.55 | 0.00 | 16.51 | 0.00 |
| 7. Khlong Thab Ma, Rayong River | 0.00 | 8.27 | 0.00 | 4.55 | 0.00 | 4.42 | 0.00 |
| 8. Private Water Sources (Water Stress) | 12.00 | 13.01 | 0.00 | 7.95 | 0.00 | 5.70 | 0.00 |
| 9. Rainwater from Samnak Bok Pond (Water Stress) | 0.00 | 0.35 | 0.00 | 0.00 | 0.00 | 0.00 | 0.00 |
| Total | 432.70 | 287.13 | 0.00 | 256.89 | 0.00 | 204.53 | 0.00 |
Remark : * Water pumped from Nong Pla Lai Reservoir exceeded the permitted volume by 17.51 million cubic meters. This followed projections discussed during a meeting of the Eastern Region Keyman Water War Room, which indicated that during October–November 2025 reservoir storage would exceed the Upper Rule Curve. The Royal Irrigation Department therefore needed to release water to prevent overflow. The Company accordingly adjusted its pumping plan to increase water pumping in place of reservoir releases, enabling the Royal Irrigation Department to manage reservoir water levels more effectively.
The main water sources allocated by the Royal Irrigation Department (RID) cover the period from November to October of the following year. Each year, the RID informs non-agricultural water users (domestic consumption and industrial sectors) of the permitted water allocation for that year. The allocation depends on several factors, including reservoir storage at the beginning of the dry season (November), the minimum storage levels, irrigation water supply plans for the agricultural sector, and water releases required to maintain ecological balance. During each allocation year, water usage is monitored so that additional water may be allocated if reservoir inflows increase during the year, in line with water demand.
In 2025, regarding water pumping from the Bang Pakong River, the Company organized a meeting with Bang Pakong River Basin water users and relevant stakeholders to obtain a resolution on water pumping on 4 June 2025. The meeting approved the Company to begin pumping water during June–November 2025 to supply domestic and industrial water users, mainly in Chachoengsao Province. Part of the pumped water was also diverted and stored in Bang Phra Reservoir as a reserve supply for water users in Chachoengsao and Chonburi during the 2026 dry season.
Water Management in 2025 the Company faced challenges in water management within the Eastern Economic Corridor (EEC) due to the handover of assets to the Treasury Department. The Company therefore accelerated the completion of the Nong Pla Lai – Nong Kho – Laem Chabang pipeline project in early 2025 in order to supply water to Pluak Daeng – Bo Win and Chonburi areas and minimize impacts on the Company’s customers. Overall, at the beginning of 2025, rainfall and reservoir inflows in Rayong and Chonburi were mostly below the long-term average. The Company therefore implemented the following measures to support water management in 2025:

The total volume of water pumped and managed by the Company in 2025 was 204.53 million cubic meters, representing a decrease from 2024. This decline was mainly due to additional alternative water sources becoming available for users in the Map Ta Phut area, resulting in reduced demand for water supplied by the Company. At the same time, economic slowdowns in certain industrial sectors led to reduced production and lower water consumption. In addition, some users began sourcing water from the Treasury Department’s pipeline system.
Overall Water Consumption by Service Area

Tap Water Consumption of the Company
The Company places importance on water use within its operational areas, including office buildings, pumping stations, and staff residences, by encouraging employees to use water efficiently and recognize the value of water. In 2025, the Company’s average tap water consumption was 2,611.08 cubic meters per month, with water supplied by the Metropolitan Waterworks Authority (MWA) and the Provincial Waterworks Authority (PWA). Details of water consumption by location are as follows:
| Location | Water Supplier | Average Water Usage Amount (cubic meter/month) |
Total Water Usage Amount (cubic meter) (Disclosure 303-3) |
Effluent Amount (cubic meter)5 (Disclosure 303-4) |
Water Usage Amount (cubic meter) (Disclosure 303-5) |
||||||||
|---|---|---|---|---|---|---|---|---|---|---|---|---|---|
| 2023 | 2024 | 2025 | 2023 | 2024 | 2025 | 2023 | 2024 | 2025 | 2023 | 2024 | 2025 | ||
| East Water Building1 | MWA. | 1,547.17 | 1,571.08 | 2,167.00 | 18,566.00 | 18,853.00 | 26,004.00 | 14,852.80 | 15082.40 | 20,803.20 | 3,770.60 | 3,770.60 | 5,200.80 |
| Operation Office2 | PWA. | 45.67 | 39.67 | 23.08 | 548.00 | 476.00 | 277.00 | 438.40 | 380.80 | 221.60 | 95.20 | 95.20 | 55.40 |
| 22 Water Pump Stations3 | PWA. | 405.42 | 429.75 | 411.33 | 4,865.00 | 5,157.00 | 4,936.00 | 3,892.00 | 4,125.60 | 3,948.80 | 1,031.40 | 1,031.40 | 987.20 |
| Staff Residence4 | PWA. | 17.33 | 1.33 | 9.67 | 208.00 | 16.00 | 116.00 | 166.40 | 12.80 | 92.80 | 3.20 | 3.20 | 23.20 |
| Total | 1,681.42 | 2,015.58 | 2,611.08 | 20,177.00 | 24,187.00 | 31,333.00 | 16,141.60 | 19,349.60 | 25,066.40 | 4,035.40 | 4,900.40 | 6,266.60 | |
Remarks
- Refers to water consumption at the Group’s head office (18th and 22nd–26th floors) and all common areas, totaling 26,004.00 cubic meters. Wastewater from the building is treated through the building’s wastewater treatment system until it meets the Building Wastewater Discharge Control Standard B.E. 2567 of the Ministry of Natural Resources and Environment before being discharged into the Bangkok Metropolitan Administration (BMA) drainage system. In addition, the East Water Building reused 158 cubic meters of reclaimed water from the building’s wastewater treatment system.
- Refers to water consumption at the Thab Ma Office. The Chachoengsao Office shares a water meter with the Chachoengsao Head Tank, while the Nong Pla Lai Office shares a water meter with the new Nong Pla Lai booster pumping station.
- Refers to pumping stations where 14 stations receive tap water supply from the Provincial Waterworks Authority (PWA) and the Company produces its own tap water at 4 stations. The raw water used at these stations is considered non-revenue water (NRW), namely: Nong Kho Pumping Station, Prasae Pumping Station 2, Nong Pla Lai Pumping Station 3, and Hub Bon Receiving Station. The remaining 4 stations do not have tap water supply.
- Refers to water consumption at staff residences located at the Thab Ma raw water reserve pond. Residences at the Chachoengsao Head Tank share the water meter with the Chachoengsao Head Tank.
- Wastewater discharged from households and buildings is estimated at approximately 80.00% of total water consumption, according to the Manual of Community Wastewater and Wastewater Treatment, Pollution Control Department, Ministry of Science, Technology and Environment.
Non-Revenue Water Control
Water is a vital resource for the sustainable development of the global community. However, water scarcity has continued to increase and is insufficient to meet the needs of the agricultural, domestic, and industrial sectors, which poses a major challenge to sustainable water resource management. In response, the United Nations declared the international action plan for the period 2018–2028, entitled “Water for Sustainable Development,” which promotes integrated water resources management to achieve economic, social, and environmental objectives.
Non-Revenue Water (NRW) refers to water within the system that does not generate revenue, resulting in waste of both pumping energy and water resources during pumping and distribution before reaching customers. The Company has long recognized the importance of this issue and has therefore planned its pumping and distribution operations in a manner that does not affect water quality, enabling the Company to reduce water loss. The Company has also established a policy to control non-revenue water at not more than 2.50% of the volume of water pumped for direct distribution into the system. In addition to studying and evaluating water management capability, the Company also places importance on exploring modern technologies suitable for the Company’s pumping and distribution system.
In 2025, the Company was able to control non-revenue water in the pipeline at 1.21% of the pumped volume (direct distribution). The Company carefully manages activities and operations that pose a risk of water loss, with primary consideration given to potential impacts on water users, enabling the Company to maintain water loss at a level lower than in 2024.
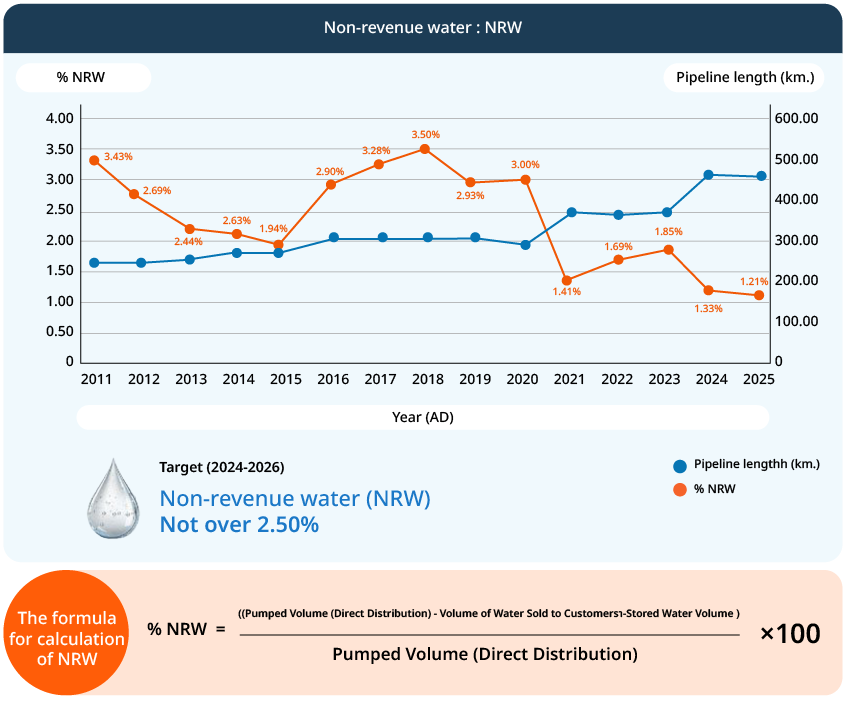
The Company’s volume of pumped water in 2022-2025
| Year | Pumped Volume (Direct Distribution) (m³) | Volume of Water Sold to Customers (m³) | Stored Water Volume (m³) | Water Loss Volume (m³) | % NRW |
|---|---|---|---|---|---|
| 2022 | 284,856,822 | 263,692,366 | 16,355,523 | 4,817,933 | 1.69 |
| 2023 | 299,251,262 | 260,592,055 | 33,122,633 | 5,536,574 | 1.85 |
| 2024 | 275,052,991 | 243,150,509 | 28,236,390 | 3,666,092 | 1.33 |
| 2025 | 217,740,968 | 198,086,642 | 17,011,646 | 2,642,681 | 1.21 |
- Water Loss Volume = Pumped Volume (Direct Distribution) – Volume of Water Sold to Customers – Stored Water Volume
- Pumped Volume (Direct Distribution) refers to the volume of water pumped from the source and delivered directly to customers.
- Volume of Water Sold to Customers refers to the volume of water measured by customer meters.