Greenhouse Gas Emissions
In 2026, the Company revises its targets in alignment with Thailand’s commitments announced at COP30 on 19 November 2025, aiming to reduce greenhouse gas emissions by 47.00% by 2035 (using 2025 as the base year) and to achieve net zero greenhouse gas emissions by 2050.
Based on the Company’s greenhouse gas emissions assessment, Scope 2 emissions, mainly from electricity consumption, represent the largest share. The Company has therefore established strategies to achieve its emission reduction targets under the Reduce – Offset – Replace framework as follows:
| Reduce (Energy Reduction) | Offset (Carbon Compensation) | Replace (Substitution) |
|---|---|---|
|
|
|
In 2025, the Company installed and utilized solar energy systems at the Head Office building, pumping stations, and industrial water production systems, totaling 196,865.61 kWh. This resulted in a reduction of 93.51 ton-Co2eq.
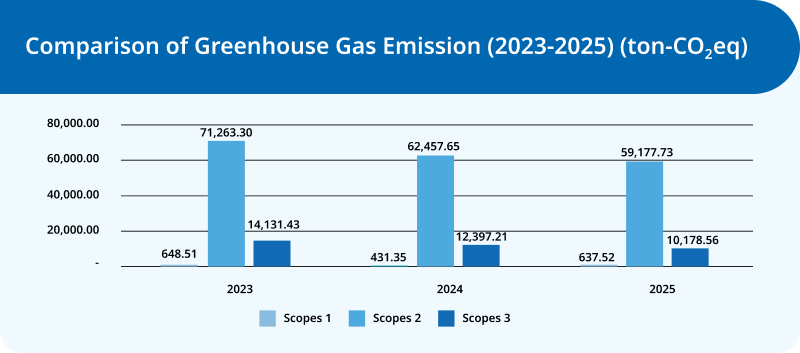
The Company’s greenhouse gas emissions (Disclosure 305-1,305-2,305-3)
| Greenhouse Gas Emissions | 2021 | 2022 | 2023 | 2024 | 2025 |
|---|---|---|---|---|---|
| Direct greenhouse gas emissions – Scope 1 (ton-CO2eq) |
418.22 | 296.46 | 648.51 | 431.36 | 637.52 |
| Indirect greenhouse gas emissions – Scope 2 (ton-CO2eq) |
80,452.38 | 61,899.27 | 71,263.30 | 62,457.65 | 59,177.73 |
| Indirect greenhouse gas emissions – Scope 3 (ton-CO2eq) |
*Data not collected | 14,096.02 | 12,356.98 | 10,178.56 | |
| Others: Diesel fuel (EF bio fuel) (ton-CO2eq) | *Data not collected | 8.95 | |||
| Total Scope 1 and 2 (ton-CO2eq) | *Data not collected | 71,911.81 | 62,889.01 | 59,815.25 | |
| Total Scope 1, 2 and 3 (ton-CO2eq) | *Data not collected | 86,007.83 | 75,245.99 | 69,993.81 | |
In 2025, the Company assessed the materiality of indirect greenhouse gas emissions under Scope 3 and identified significant categories, namely Fuel- and Energy-related Activities (including the acquisition of fuels for electricity generation, diesel fuel, and gasoline). In addition, the category Purchased Goods and Services (including office paper consumption and tap water consumption) scored below the materiality threshold, indicating that greenhouse gas emissions from these activities are relatively insignificant. Nevertheless, the Company remains committed to reducing paper and water consumption as part of its efforts toward achieving net zero greenhouse gas emissions.
Diagram: Comparison of the Company’s greenhouse gas emissions (2023–2025)
Greenhouse gas emissions intensity of the Company (Scopes 1, 2, and 3) from raw water pumping and distribution (Disclosure 305-4)
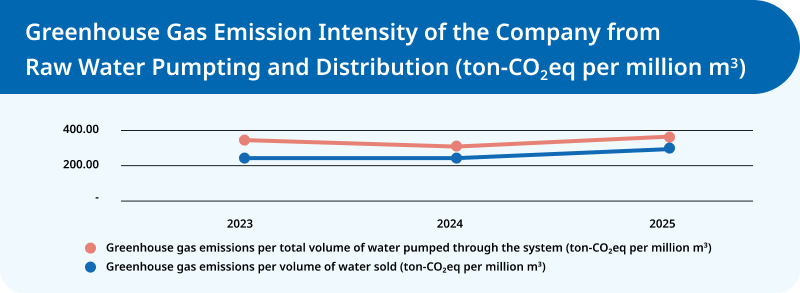
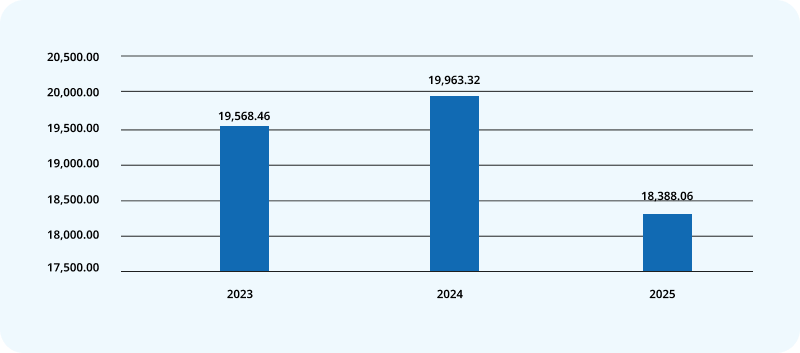
Diagram: Comparison of Scope 2 greenhouse gas emissions of UU PCL (2023–2025) (ton-CO₂eq)